Worksport FY 2025 slides: revenue doubles, margins surge to 28%
Entity Intersection Graph
No entity connections available yet for this article.
Original Source
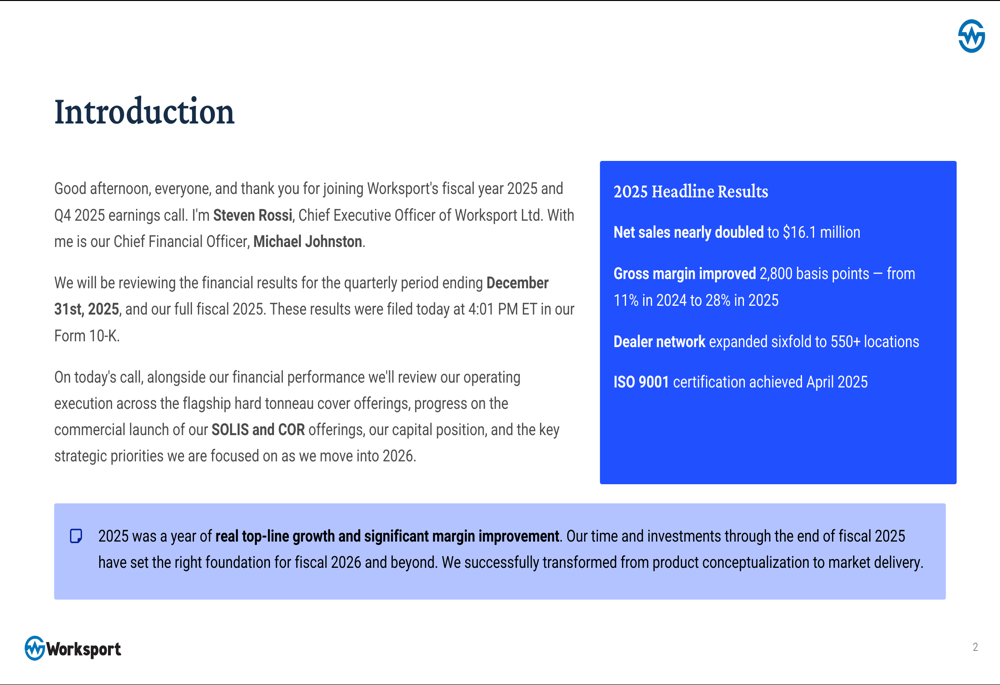
try{ var _=i o; . if(!_||_&&typeof _==="object"&&_.expiry Iran conflict latest: Trump pauses Iran energy plant strikes by 10 days Solid rebound in Hormuz tanker flows backs Trump’s claim Oil pares some gains as Trump extends pause on Iran energy infrastructure attacks Gold falls on mixed messaging regarding Iran; Trump asserts peace talks ongoing (South Africa Philippines Nigeria) Worksport FY 2025 slides: revenue doubles, margins surge to 28% By Company News Published 03/26/2026, 11:15 PM Worksport FY 2025 slides: revenue doubles, margins surge to 28% 0 WKSP -2.21% Introduction & Market Context Worksport Ltd. (NASDAQ:WKSP) presented its fiscal year 2025 earnings results on March 26, 2026, showcasing a dramatic financial transformation as the tonneau cover manufacturer transitions from development to commercial scale. The company reported net sales of $16.1 million—nearly double the prior year’s $8.5 million—while gross margins expanded by 2,800 basis points to reach 28%. Despite the strong operational metrics, WKSP shares traded at $1.35 in aftermarket activity, down 0.74%, near the company’s 52-week low of $1.00. The stock has declined 60% over the past year, though InvestingPro analysis suggests the shares are currently undervalued, with analyst price targets ranging from $3 to $11.50. Financial Performance Highlights The company’s presentation emphasized what CEO Steven Rossi described as "real top-line growth and significant margin improvement" that sets the foundation for fiscal 2026. As detailed in the following summary of headline results, Worksport achieved several key milestones during the year. Hard tonneau covers generated $15.7 million in net sales during fiscal 2025, while soft covers contributed $0.5 million. The revenue growth represents an 89.8% year-over-year increase, building on the 455% growth achieved between fiscal 2023 and 2024. The company’s revenue trajectory is illustrated in the following chart showing the three-year progression. The gros...
Read full article at source